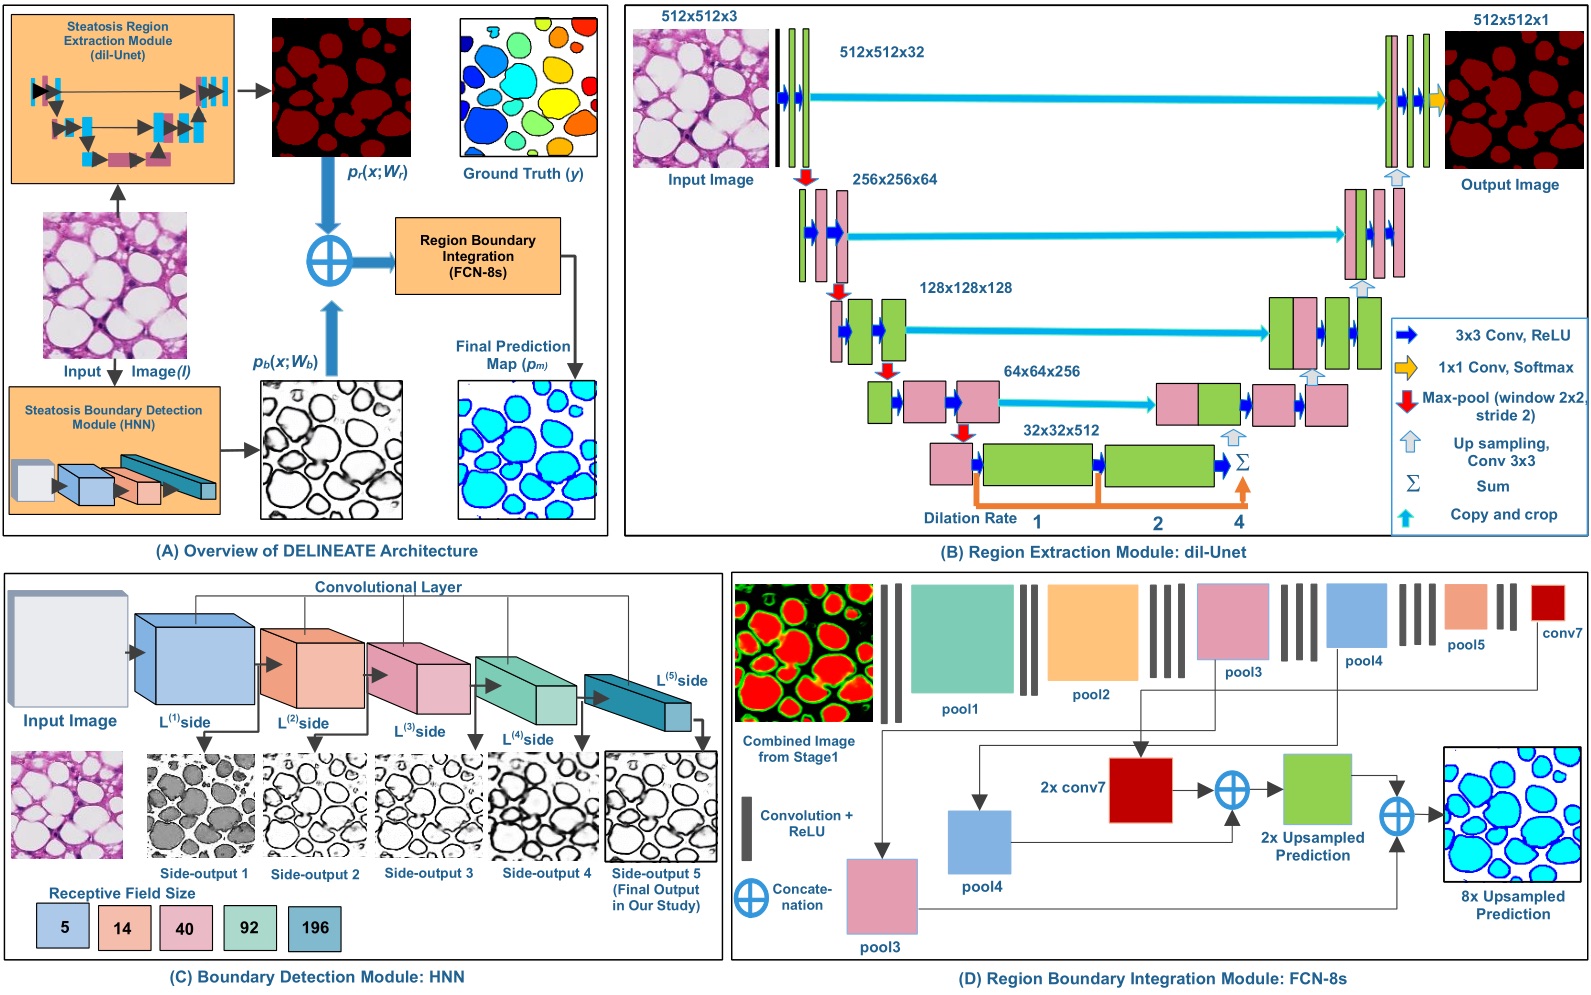
| Schema of the deep learning based steatosis segregation method: DELINEATE. |
 |
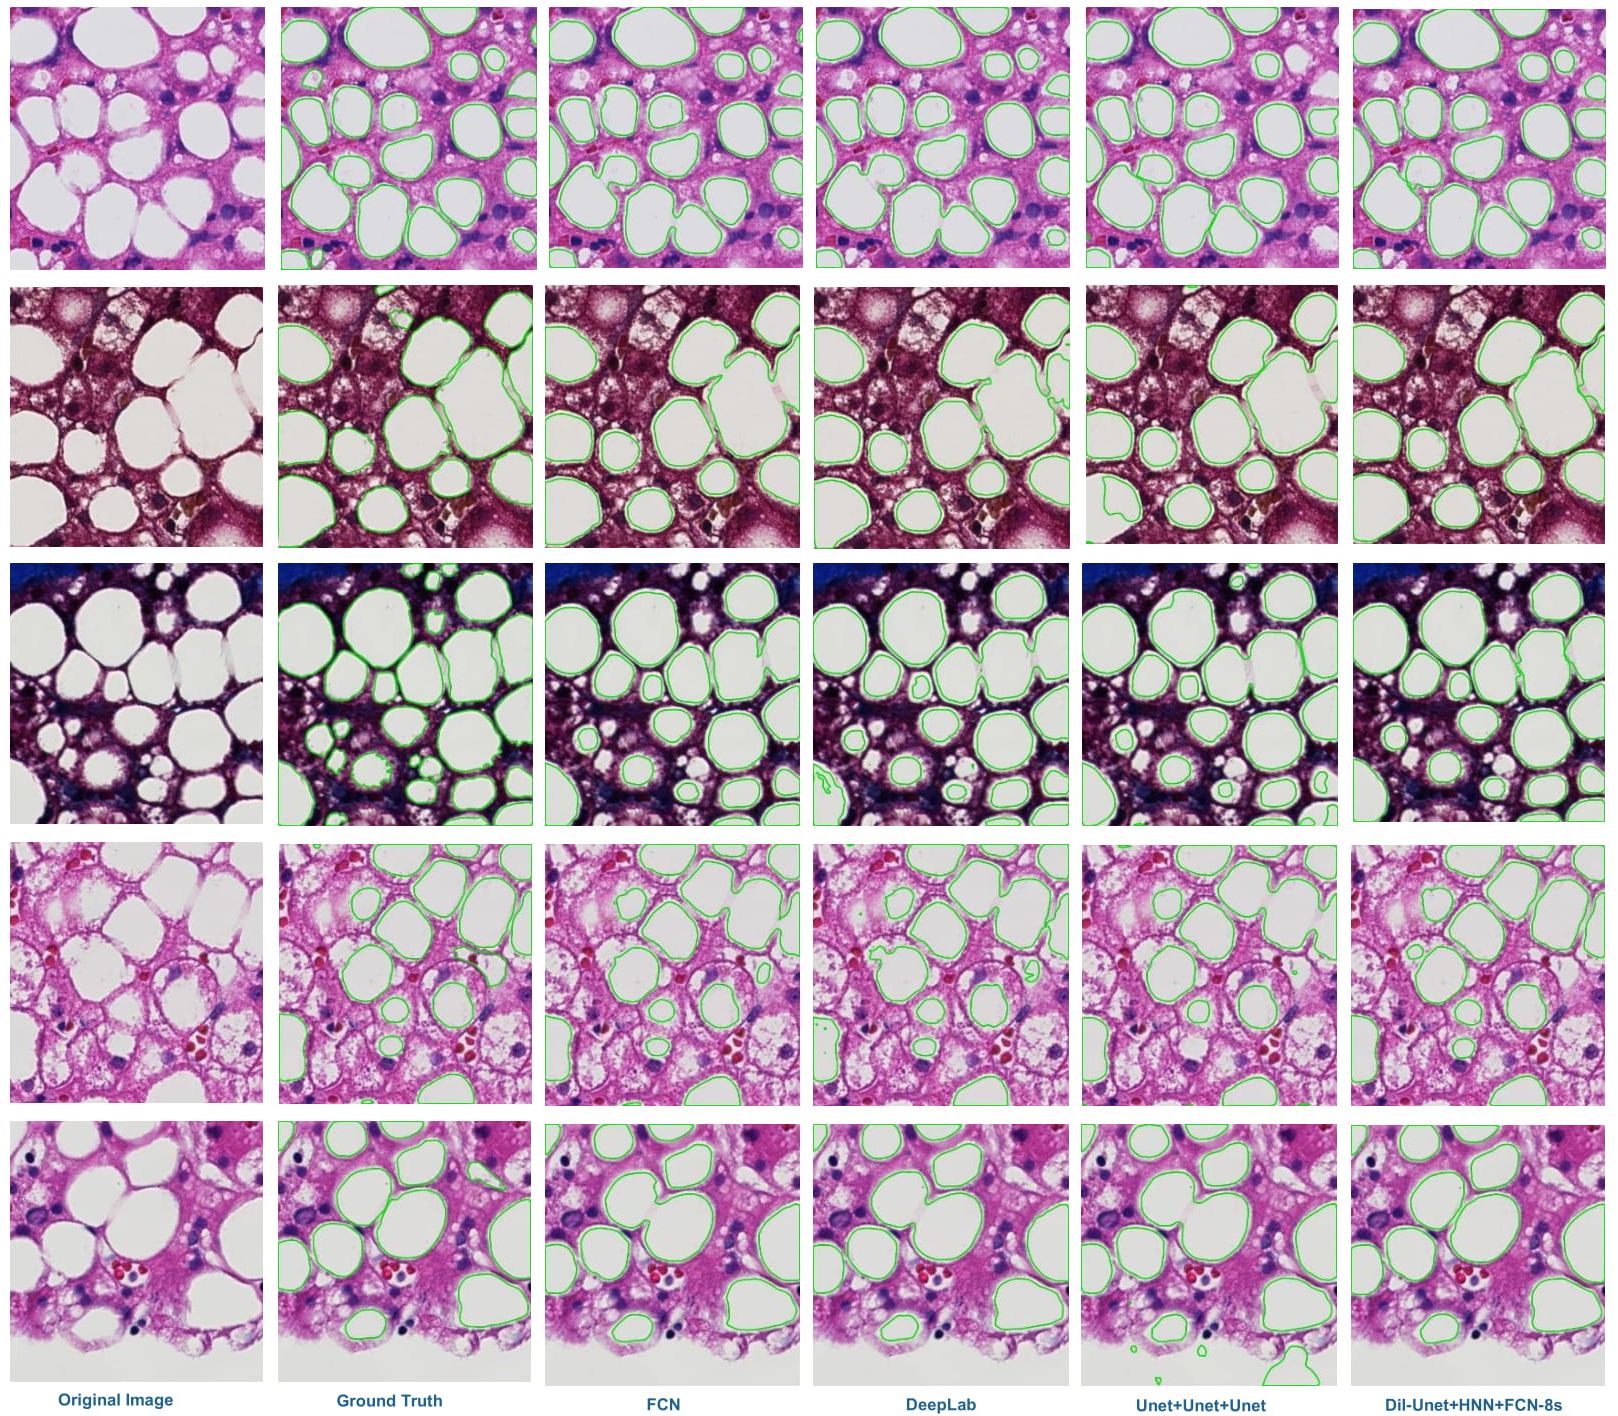
| Automatically recognized steatosis droplet boundaries in green are overlaid with representative image patches (in rows). From left to right: the original image, ground truth, results from FCN, DeepLab V2, Unet+Unet+Unet (one variation of our proposed model), and dil-Unet+HNN+FCN-8s (our proposed DELINEATE model). These images present overlapped steatosis droplets with large variations in color and shape. Note that our proposed DELINEATE model can better delineate overlapped steatosis boundaries than other models in the comparison set.
|
 |
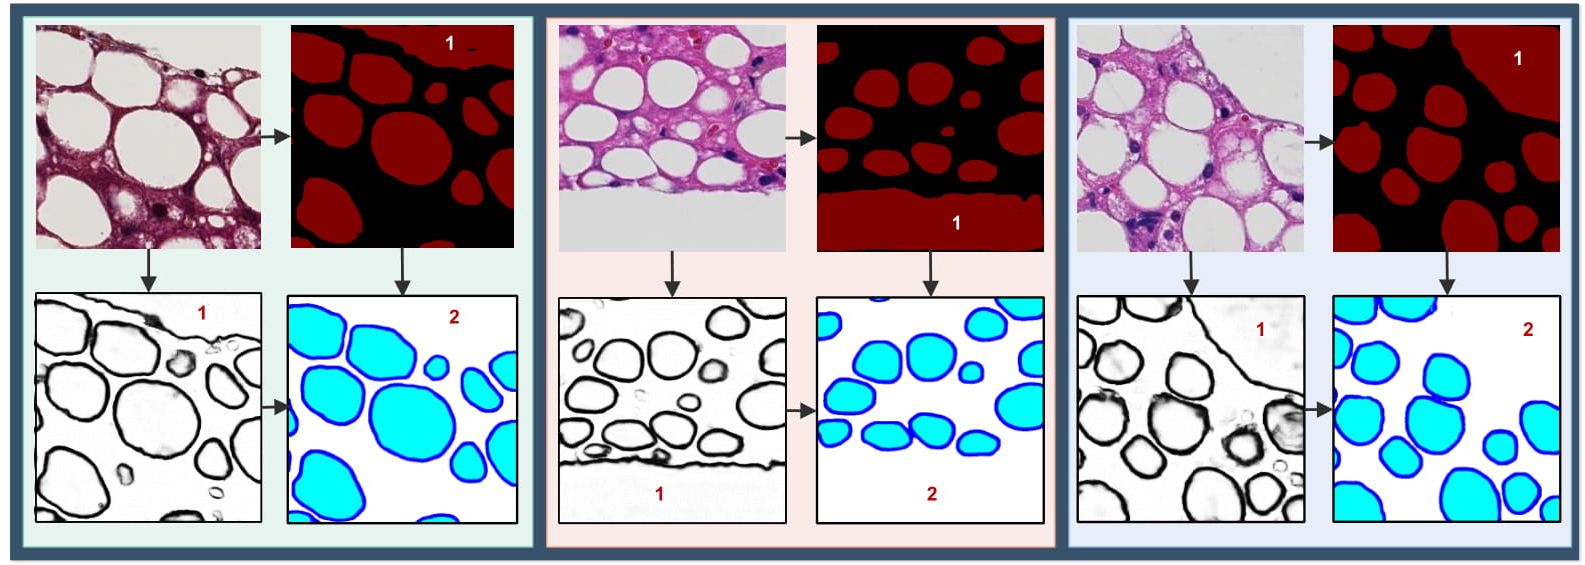
| Three typical regions with improved steatosis segmentation by the region and boundary integration network are presented. Top-Left: input image; Top-Right: output from the region extraction model; Bottom- Left: output from the boundary detection model; and Bottom-Right: final output of the integration model. False steatosis region captured by the region prediction model and corrected false steatosis regions by the final integration network are labeled by “1” and “2” in each example region. |
 |
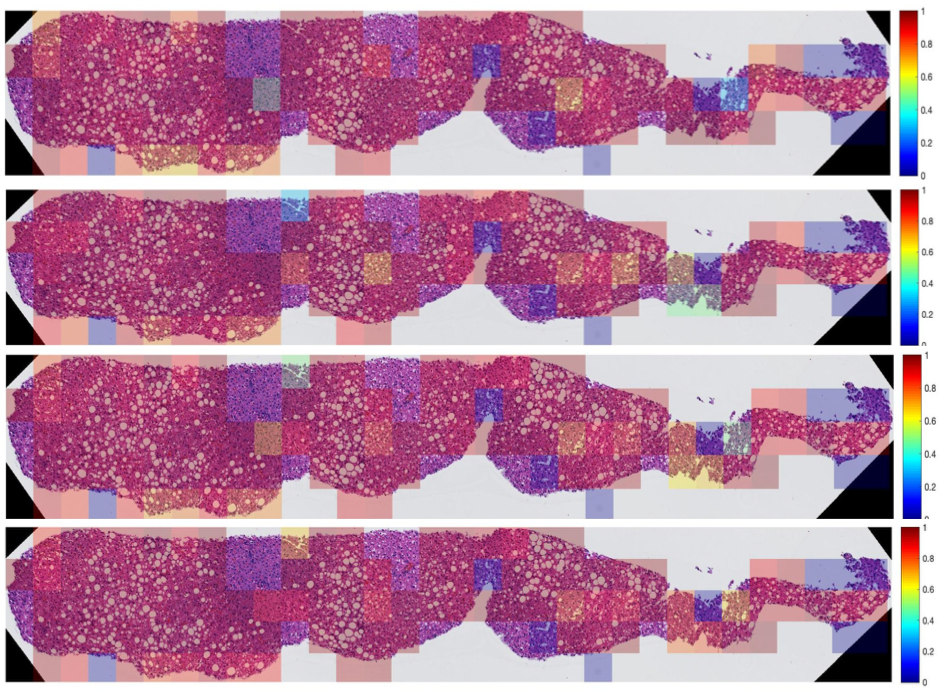
| Heat maps of image patch-wise performance variations of the proposed DELINEATE model, as measured by (a)Precision, (b)Recall, (c)F1-Score, and (d) object-wise Dice index, are superimposed on an original whole-slide liver tissue component image.
|
 |
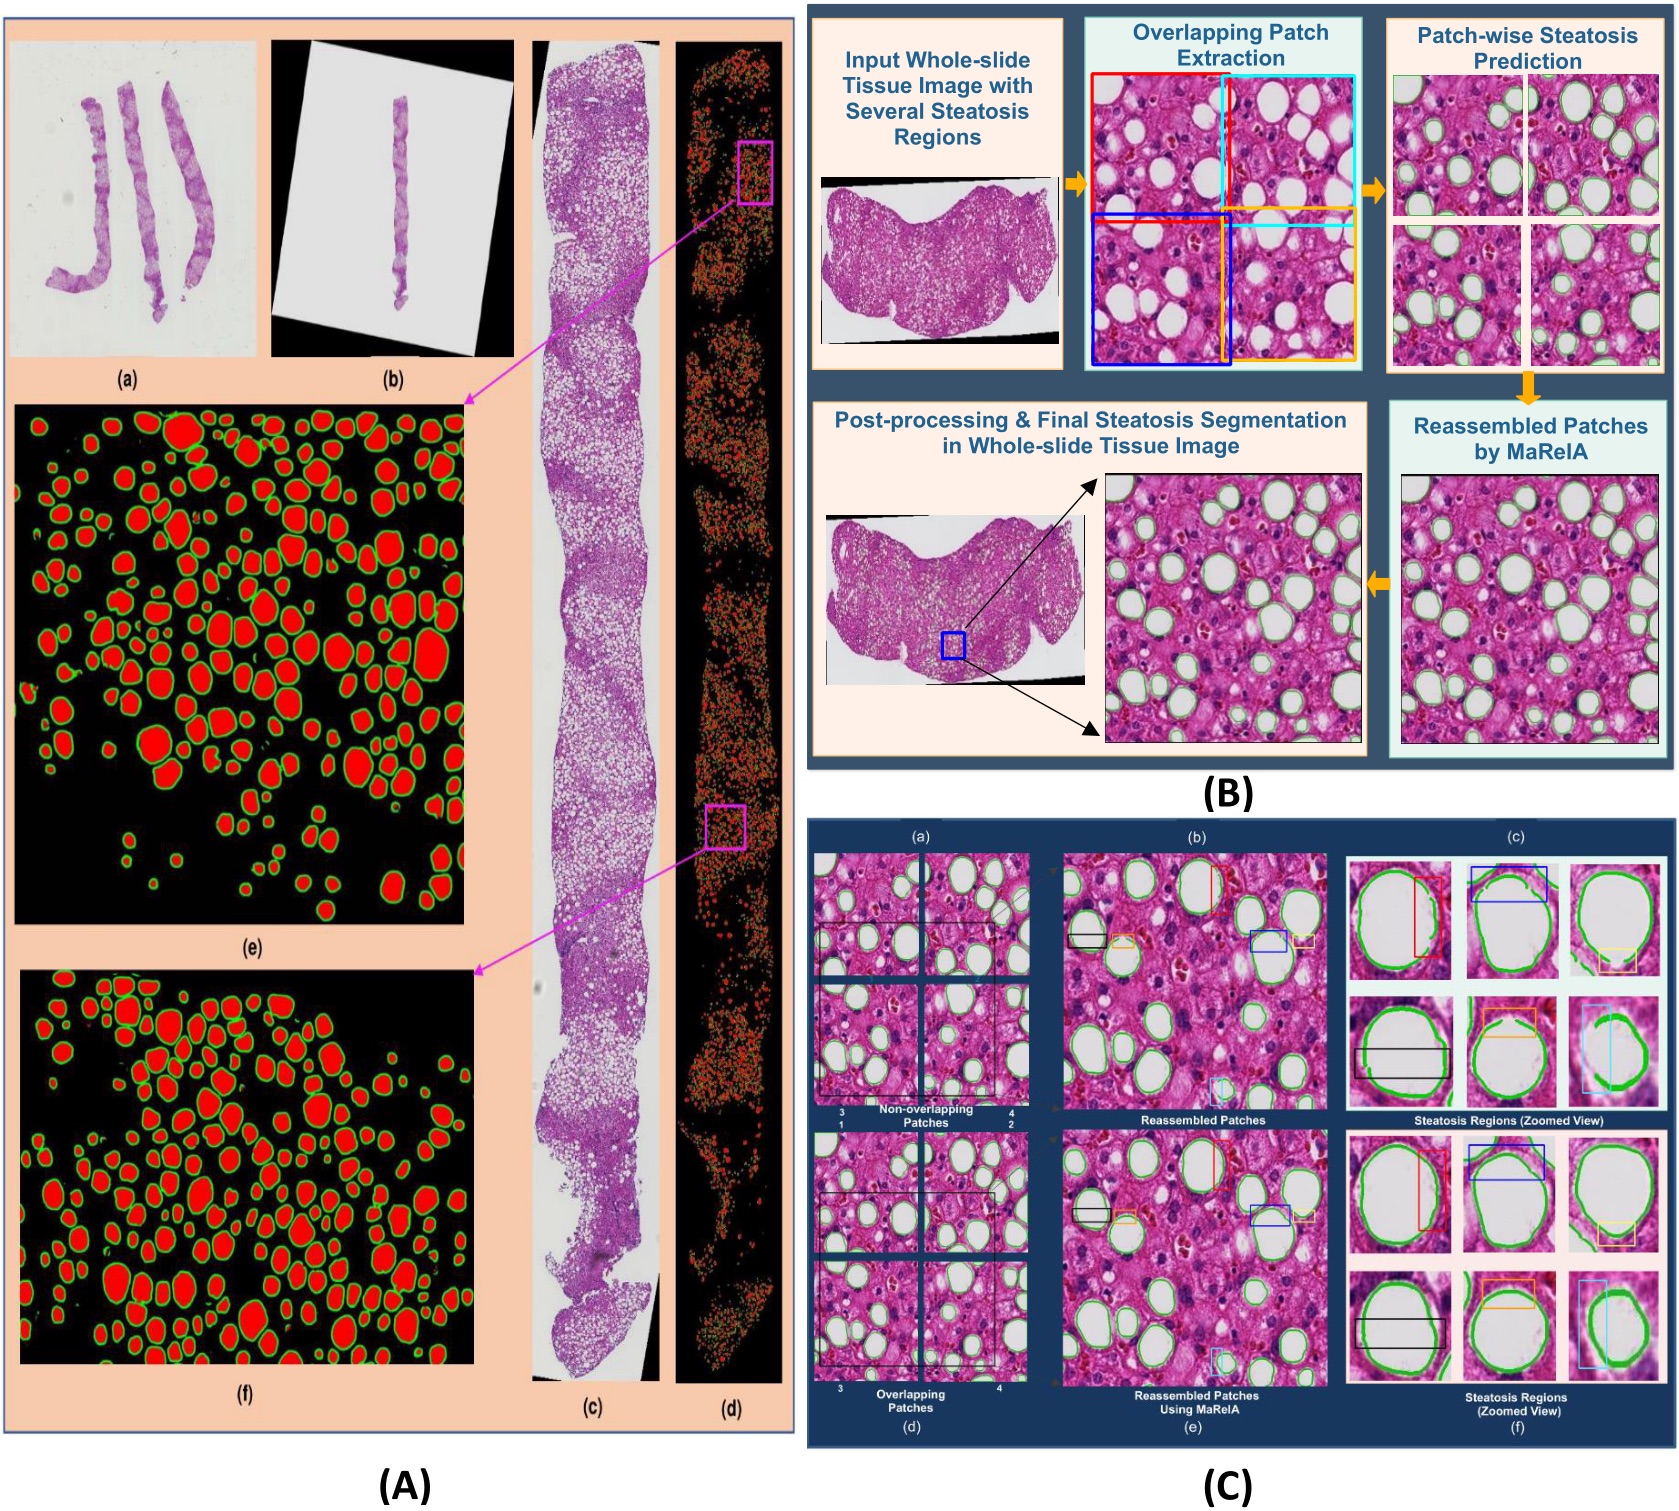
| (A) Whole tissue steatosis prediction. (a) a low resolution whole slide liver image containing multiple tissue components; (b) one complete tissue component extracted at a low resolution; (c) the highest resolution tissue component extracted after rotation and interpolation; (d) steatosis regions and the boundary masks in the complete tissue component detected by DELINEATE model; (e-f): close-up views of two representative tissue regions in purple rectangles in (d). (B) Block diagram of steatosis quantification in whole slide liver tissue images. It consists of high resolution tissue component extraction, overlapped tissue region partitioning, steatosis segmentation by DELINEATE model, and patch-wise steatosis segmentation assembled by MaReIA. (C) Steatosis segmentation assembled by different methods. (a) typical four adjacent non-overlapping patches; (b) steatosis segmentation with simple concatenation; (c) close-up views of steatosis droplets with simple concatenation; (d) overlapping patches; (e) steatosis segmentation assembled by MaReIA; and (f) close-up views of assembled steatosis droplets by our proposed MaReIA.
|
 |