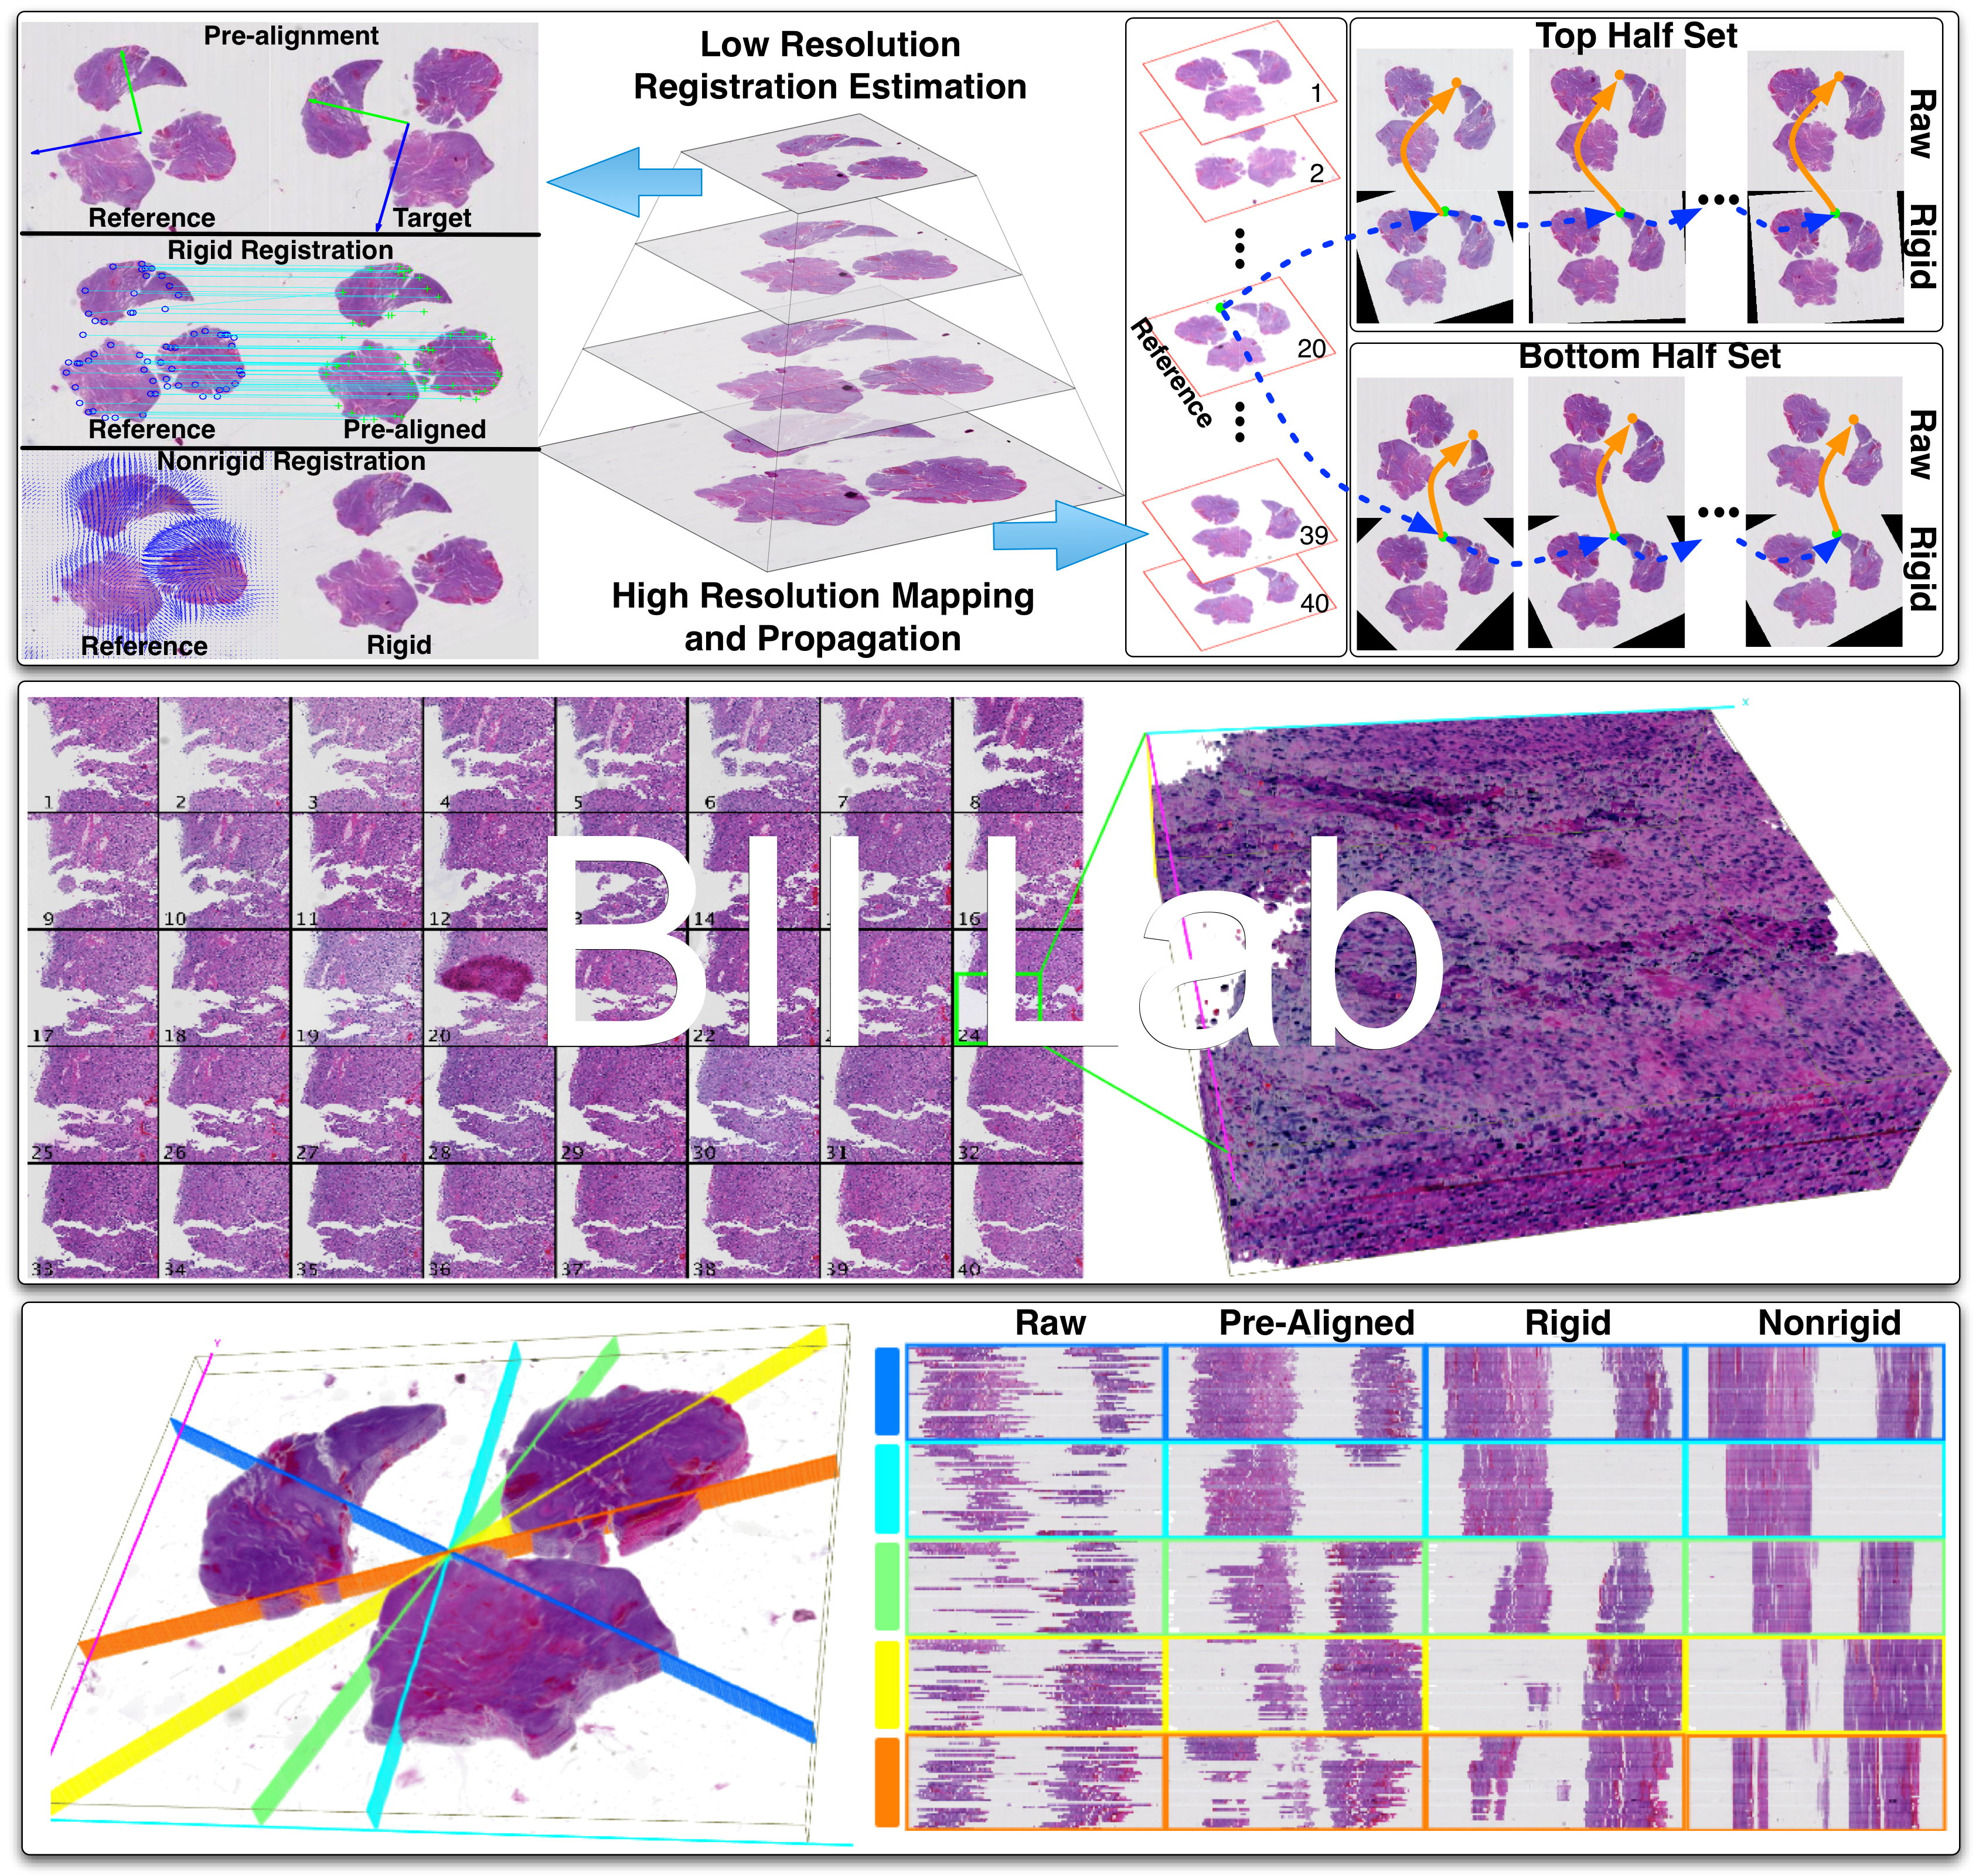
| (Top) Diagram of mapping relationships between reference and target image at low and high resolution, respectively; (Middle) Results of high resolution mapping and propagation for a 4096x4096 pixel region of serial GBM sections; A montage of the registered region is presented on the left, and a 3D rendered volume corresponding to the green box is shown on the right; (Bottom) Qualitative evaluation of registration accuracy using random cross sections. Each row in the right panel displays the y-z cross sections at each registration stage for the corresponding cutting plane in the 3D rendered volume in the left. |
|
| Results of IHC image registration: |
 |
| Results of H&E-IHC multi-stain registration: |
 |
| Results of H&E-IHC multi-stain registration: |
 |
| Results of H&E-IHC multi-stain registration: |
 |
| Results of IHC biomarker detection: |
 |
| 3-D visualization of reconstructed vessels and five different populations of biomarkers: |
 |
| Correlations between necrotic centers and spatial density of hypoxia biomarker. (Left) H&E pathology slide with a typical necrosis (green box); (Right) Hypoxia marker density (red: high; blue: low). |
 |